Sheep Ireland have been working tirelessly to ensure our reports are as user-friendly for users. Most recently, the Eurostar Profile report has been upgraded and is easier to use than ever before. Features have been put in place to make breeding section decisions as simple as possible to ensure farmers are selecting their most productive and profitable animals from their flock.
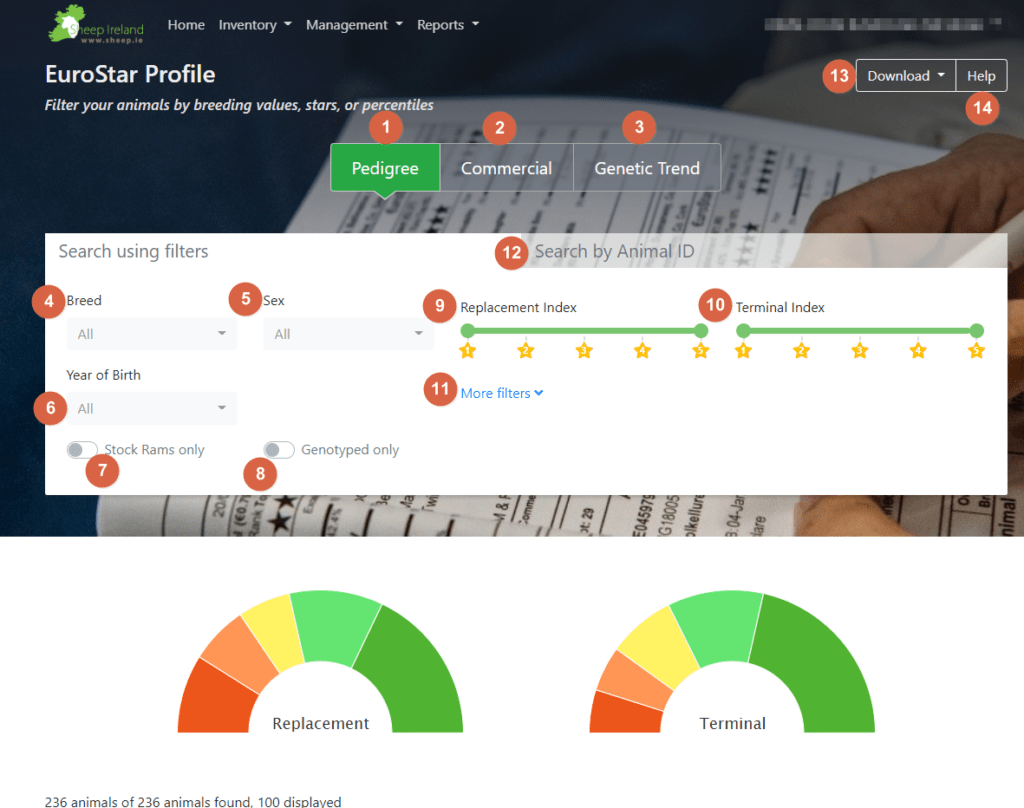
The above image is what the new Eurostar Profile report looks like and below is a step by step explanation of all new features.
- Eurostar’s of all pedigree animals in the flock are displayed
- Eurostar’s of all commercial animals in the flock are displayed
- The trend of average Euro values of all animals over several years are displayed
- Filter animals based on breed
- Filter animals based on sex
- Filter animals based of year of birth
- Select stock rams only
- Select genotyped animals only
- Pull and drag this interactable bar to filter for all animals that 1, 2, 3, 4, or 5 stars on the Replacement Index
- Pull and drag this interactable bar to filter for all animals that 1, 2, 3, 4, or 5 stars on the Terminal Index
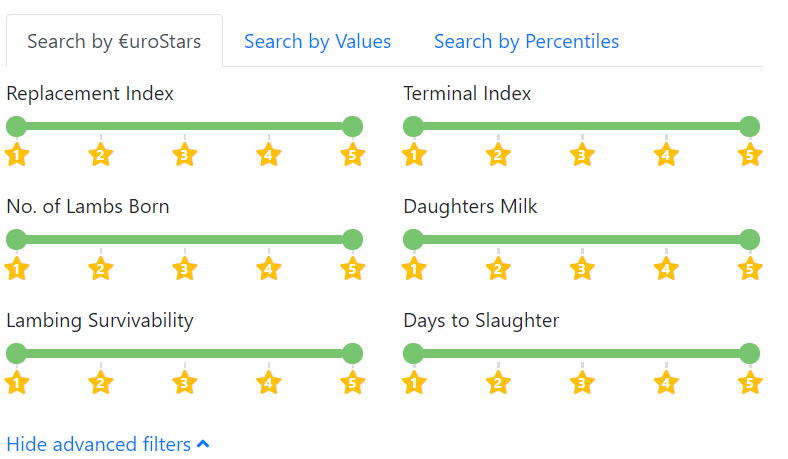
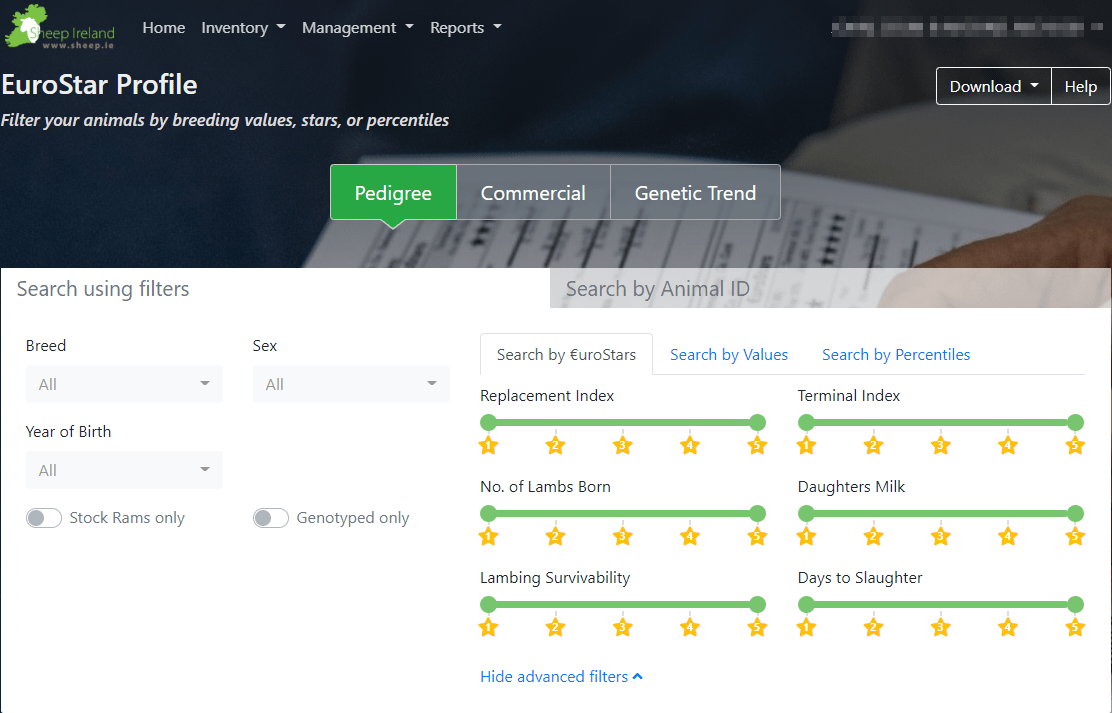
- ‘More filters’ (image below will appear )includes all sub-indexes and allows you to filter based on percentiles and Euro values of each index. If you click on ‘Hide advanced filters’ they will disappear again.

- Search animals by their ID
- Download your animals Eurostar profile. You can download your filtered selection, download all animals currently in your flock and, download all animals which will give you Eurostar indexes of your past sires that are currently a sire to any animal in your flock.
- Not sure on how to use the Eurostar Profile Report? Simply click ‘Help’ and you will be given a guided tour of the screen.
The Pie Charts
The pie charts represent the amount of animals that are in each star bracket. Hover or click on each colour and the count and % of animals are displayed for both the Replacement and Terminal Indexes. Red is 1 star, orange is 2 star, yellow is 3 star, light green is 4 star and dark green is 5 star.
When animals appear in the table
The accuracy percentage and description for each index and sub-index can be seen by hovering over the yellow stars that appear in each column. The percentile (Rank) for each index and sub-index can be seen by hovering over the yellow stars also. If an animal is in the 1st percentile it is in the Bottom 1% of the breed for that index, if an animal is in the 100th percentile it is in the Top 1% of the breed for that index.


