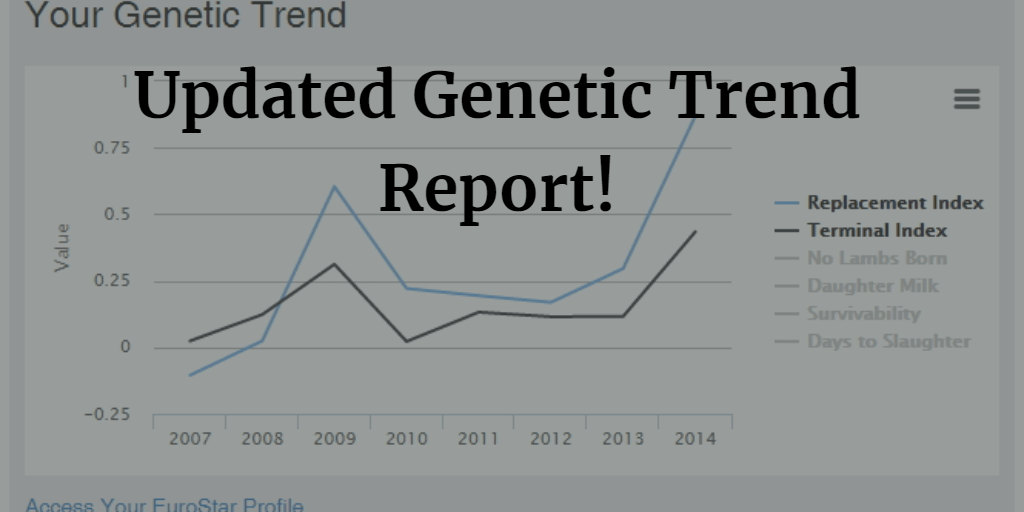
When breeders log into their Sheep Ireland account’s they will notice something different about their genetic trend report on their homepage. Previously the genetic trend of your flock as a whole only was visible, regardless of how many breeds were in your flock. However you can now view the genetic trend of your flock on a per breed basis as well as still being able to view the overall genetic trend of your flock as a whole.
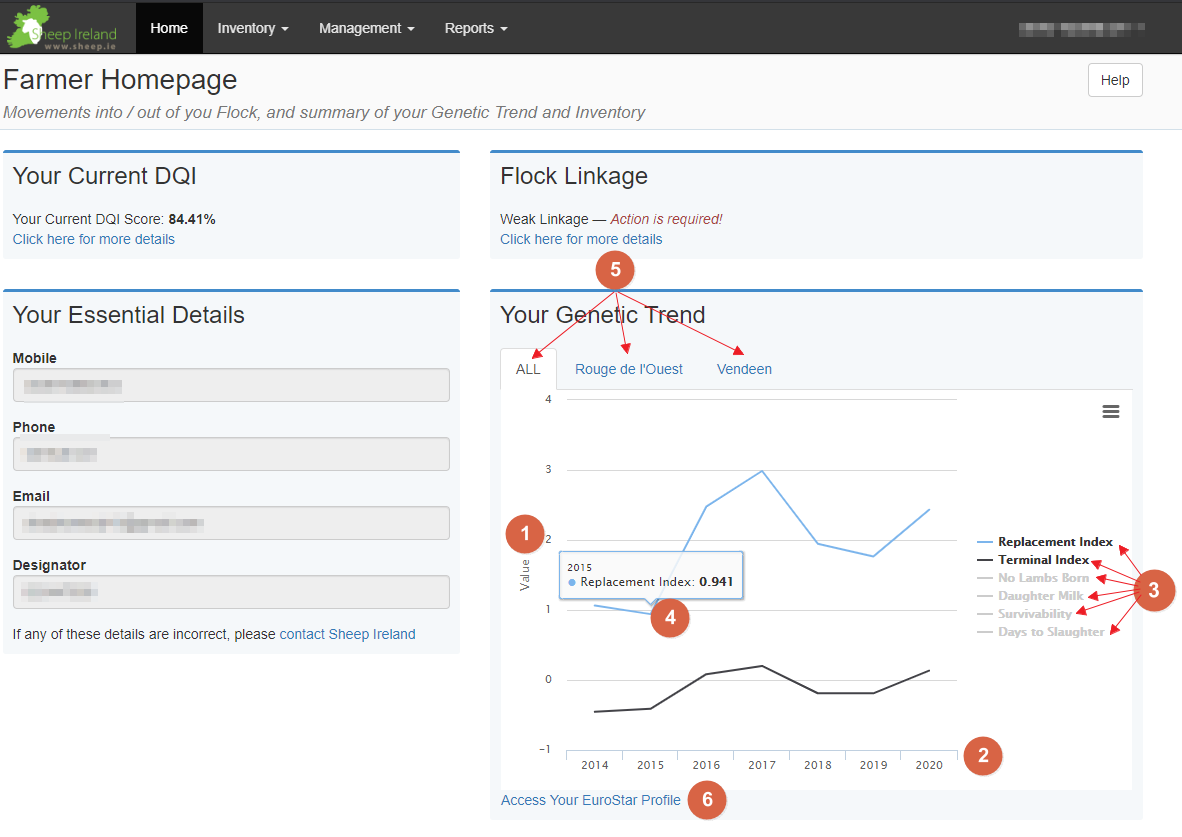
To briefly explain what exactly you are looking at on this graph, please have a look at the below image.
- Vertical axis is representing the value relative to the particular index you are looking at, ie Euros for the overall trend, Days in the Days to Slaughter Index or Percentage in the Survivability Index.
- Horizontal axis is representing progress made per year over a number of years
- Each index and sub index can be selected, depending on what it is you are focusing on. You can select what you want displayed at a given time (ie one at a time, all at the same time and so on) and all index’s are represented by a specific colour (ie blue – Replacement, black – Terminal)
- You can hover over your mouse anywhere along the index line to view what the Euro value was in a given year
- You can select what breed you want to focus on when looking at your genetic trends or ‘ALL’
- You can access you current Eurostar Profile to find out more info
Sheep Ireland work tirelessly to ensure that our reports are as user friendly as possible for our users, therefore all feedback is used and implemented in any updates to our recording screens and reports. Please feel free to call us on 023 882 0451 or email on [email protected] should you have any queries or feedback.


